![]()
![]()
![]()
![]()
![]()
![]()
![]()
![]()
![]()
![]()
![]()
![]()
|
|
|
(p.111) Chapter 5 Concentration on Nonfarm Growth
As the dust cleared from a half-century of spectacular off-farm movement, the geographic pattern of urban centers on the Upper Midwest map still looked remarkably familiar (Figure 41). Excluding Twin Cities suburbs, there were 138 urban places at the advent of the new era in 1920. At the close of the era in 1980, there were 134. Twenty places were deleted from today's map through consolidations into the Twin Cities metropolis or into hyphenated complexes such as Fargo-Moor-head, Marquette-Negaunee-Ishpeming, or Wahpeton-Breckenridge. Meanwhile, 16 places were added. One hundred eighteen were unchanged. The basic pattern had indeed been set in the railroad era. Of course, that stable number of urban areas had to accommodate a flood of new nonfarm people. The result was a sharp increase in the geographical concentration of the region's population. Half of the urban centers were in just one-third of the region's counties (Table 3). Those counties accounted for 82 percent of the nonfarm growth between 1940 and 1980, and by 1980 they were home to nearly three-fourths of the region's total nonfarm population. The counties were mainly in clusters where historic location factors had seeded several cities in close proximity (Figure 42). In today's highway era, their labor markets and trade areas have become intertwined. In a few other cases, one or two counties form the principal commuter shed or labor market for an isolated major growth center, far from any others. Altogether, 18 of those major clusters were on the 1980 map.61 The Minnesota Core The
largest cluster of counties centered on the
Twin Cities. More than ever, that cluster was
the urban core of the Upper Midwest. With 2.7
million in nonfarm population in 1980, it
accounted for 37 percent of the population of the entire region and 44 percent of the growth
since 1940. The two Central Counties included
the cities of Minneapolis and St. Paul and
about half of the suburban population. A surrounding
Commuter Ring of counties included
virtually all the remainder of the commuter
shed, or daily urban system. Beyond that,
the Satellite Ring of counties included more
than half-a-dozen partly independent urban centers, whose commuter sheds
overlap the Twin
Cities. Industries in the Satellite Ring
included many branch plants of Twin Cities
firms, and many manufacturers and distributors
served primarily the Twin Cities market.
A significant part of the retail and service trade
was siphoned off to the Twin Cities. Cities
in the Satellite Ring drew a substantial business
conference trade from the metropolitan area,
and lakes provided a large amount of weekend recreation for people from the
Central
Counties and Commuter Ring. The Central
Counties retained 52 percent of the cluster's
total population in 1980. But their growth
in the preceding 40 years was only 64 percent,
compared with 524 percent in the Commuter
Ring and 137 percent in the Satellite
Ring.
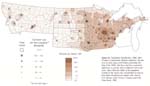
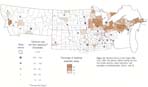
Figure 41. Population Distribution, 1980. After 50 years of spectacular off-farm migration, the pattern of urban places still looked remarkably like that of the 1920s. But there had been important differences in growth rates at different towns and cities. More than four-fifths of all population growth in the region was concentrated in areas of more than 40 persons per square mile. Source: U.S. Bureau of the Census, County and City Data Book, 1982.
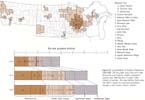
Figure 42. Concentration of Nonfarm Population, 1940-1980. The bar graph shows that more than 80 percent of the region's nonfarm population growth since 1940 has been in major urban dusters of counties. The map outlines those areas, and Table 3 details the numerical population changes in each cluster. Source: note 61.
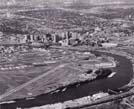
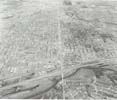
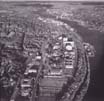
The core area of the regional metropolis spreads from downtown St. Paul (center) toward central Minneapolis (upper left), 10 miles to the west, in 1982. In 1862 the St. Paul and Pacific Railroad began at the riverboat landing, just upstream from the nearest bridge in the foreground, and crossed the wide-open spaces to its western terminal at the doorstep of Minneapolis. Photos, Cook's Aerial Photos, Minneapolis, MN.
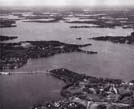
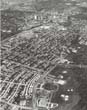
Viewed from Gray's Bay, at the eastern end of Lake Min-netonka in 1982, these wooded suburbs in the ivestern part of the Twin Cities metropolis resemble major resort areas of the Minnesota and northern Wisconsin lake districts. Photo, Cook's Aerial Photos, Minneapolis, MN.
Figure 43. Vacation Homes in the Upper Midwest, 1980. The pattern reflects mainly the location of lake districts, major reservoirs, and mountain recreational areas. Source: note 61.
(p.117)
Table 3. Nonfarm Population in the Upper Midwest, 1940-1980
Year-round nonfarm population increased two and one-half times, to more than one-quarter million since 1940. The summer and winter weekend populations probably added another 50,000 to 150,000. Population growth was the result of three factors. One was the growing discretionary spending of vacation home owners and tourists. Another was the growing use of lakeshore houses and condominiums for retirement. A third was the entry of people who were in the urban labor force but self-employed and footloose. They wrote, ran conferences, sold schoolbooks, consulted, crafted musical instruments or pottery, and worked in myriad other occupations. Many of their occupations defied the federal government's 10,000-category Standard Industrial Classification scheme. Most lived on the lakeshores, but many occupied old farmhouses amid hilly, stony, brushy or wooded pastures and an occasional tamarack bog. Many also farmed their marginal land on a small scale, part-time.
In 1985 the towering Mayo Clinic buildings and related hospitals, hotels, and apartments dominate the downtown area of Rochester, Minnesota, beyond the winding Zumbro River. Aerial photo by K. Bordner Consultants, Inc., Minneapolis, MN.
(p.119)
South of the Twin Cities, six urban areas composed the Southern Minnesota cluster. All grew early as county seat trade centers on the fertile prairies. Rochester, Owatonna, Waseca, and Mankato stood along one east-west rail line between Chicago and South Dakota; Austin and Albert Lea on another. All six were located at intersections with north-south lines between the Twin Cities and the midcontinent. In the subsequent years, they were incubators for not only the Mayo Clinic and Hormel but also two dozen medium or large industrial and service companies. Nonfarm population in the Southern Minnesota cluster more than doubled between 1940 and 1980, to nearly 300,000. The Eastern Transition Zone The Chippewa Valley-LaCrosse cluster in 1980 had a large element of long-established manufacturing industries, a strong trucking-based wholesale trade with the surrounding area and the Twin Cities, and several colleges and universities that shared in the post-World War II enrollment boom. The logging industry of the Chippewa Valley was a major factor in the early development of Eau Claire-Chippe-wa Falls and Winona. It also augmented the early role of LaCrosse as a river-rail transfer point. The commuter sheds of those four cities outline the modern urban cluster. Nonfarm population nearly doubled between 1940 and 1980, to about 340,000. Still farther east, the logging industry gave rise to another line of towns at Wisconsin river power sites from Rhinelander southward through Merrill to Wausau. In 1980 they were the northern centers of the massive Wisconsin Valley pulp and paper industry. But Rhinelander is also the principal service center for another major concentration of lakeshore homes and resorts. Three generations of southeast Wisconsin and Chicago vacationers have swarmed to the lakes between Tomahawk, 25 miles downstream from Rhine-lander, and the headwaters area to the north. At the turn of the century, the visitors came by train on lines that were first built to haul lumber to Milwaukee and Chicago. Some families lived at the lakes all summer, and their breadwinners commuted in parlor cars and sleepers attached to local trains on weekends. Many another family made the long trip by day coach to enjoy a hard-earned week in a rental cabin. In the 1920s, family automobiles on dusty roads began slowly, but surely, to empty the passenger trains. By 1980 the train tracks were rusting beside long lines of weekend traffic on wide ribbons of pavement. Many of the depots have disappeared or stand in ruins. A few have become items of renewed curiosity and restoration efforts. Like the Minnesota Lakes cluster, those towns have added many retirees and self-employed to a growing local service base. As a result, the nonfarm population tripled to about three-quarters of a million between 1940 and 1980. The Great Plains Where the Corn and Dairy belts give way westward to the wheat country, the urban pattern breaks into a half-dozen smaller clusters or isolated counties. Those clusters were home in 1980 to 70 percent of the entire urban population of the region's subhumid and semiarid plains. Fargo-Moorhead
and Grand Forks-East Grand
Forks thrived at historic rail crossings of the
Red River. The two centers shared North Dakota's
major state university campuses. In central North Dakota, Bismarck has been a vigorous growth center in the post-World War II years. Its site on commanding bluffs above the Missouri was enhanced by the big dams on the river. The upstream Garrison Reservoir traps the mud, clears the river, and minimizes the flood risk. Meanwhile, the downstream, Oahe Dam has placed the city at the head of a 200-mile-long recreational lake. Bismarck's government center has grown and attracted other service industries. Oil and lignite firms have selected the city for regional offices. The resulting growth has generated additional agricultural service and distribution jobs. Across the river, Mandan has more than offset declining railroad employment through the effects of oil and lignite activity and residential and commercial spillover from Bismarck.
Minot
followed a different course. As a bigger
railroad center, it had to absorb larger large
government payroll came in the much more
uncertain form of a military air base. Its transportation
advantage for wholesaling shrank
somewhat with the shift from rail to highway.
While growth from 1940 to 1980 was substantial,
it was also volatile. For example, the
county nonfarm growth in the Bismarck-Mandan
labor shed was 33 percent in the 1950s,
compared with 46 percent for Minot. In the
1970s, it was 38 percent for Bismarck-Man-dan,
2 percent for Minot. Fastest growing of the Great Plains centers was Billings, which seemed to be emerging in the oil-trucking-service era as the metropolis of Montana. In its revitalized downtown, Billings developed the first suggestions of a traditional metropolitan skyline west of the Twin Cities. Meanwhile its burgeoning residential developments sprawled westward on former irrigated farmland between the Yellowstone and the rimrocks and up the wooded canyons in the breaks of the High Plains.
Though uneven, growth in all these plains nonfarm clusters was fast-154 percent between 1940 and 1980, to a total of nearly 630,000. The Western Mountain Zone Today's urban clusters in the Black Hills and Western Montana Valleys are mainly in the same counties as were the earliest settlements of ranchers and prospectors. Part of the Black Hills cluster is the historic Homestake gold-mining community, sprawled over ridgetops at Lead and jammed in the neighboring narrow canyon of Whitewood Creek, 2,000 feet below, at Deadwood. Rapid City and Sturgis stand where two sparkling creeks discharge from the wooded hills to the dry plains. The same streams once spread goldbearing gravels before the Custer expedition's scientists and the prospectors who followed them, scarcely more than a century ago. Belle Fourche is the focus of a twentieth-century federal government irrigation project where the Belle Fourche River leaves the hills. Rapid City was the main railhead. With the help of a large air base, state enterprise, and the tourist traffic, it has become the metropolis of the area. Outside the mining district, total nonfarm population of the cluster tripled to nearly 100,000 between 1940 and 1980. Meanwhile population of the Homestake district has been virtually unchanged at 16,000 to 18,000 for more than half a century.
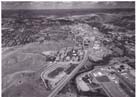
At Eau Claire, Wisconsin, in 1977, the railroad era city surrounds the early business con at the confluence of the smaller Eau Claire river with the Chippewa (upper center). Post-World War II expansion adjoins the freeway bypasses to the east (upper right) and south (foreground). Aerial photo by K. Bordner Consultants, Inc., Minneapolis, MN.
(p.122)
In a 1978 picture, Moorhead and Fargo spread along the east and west banks of the Red River. Railroad-era industrial satellite communities at Dilworth, Minnesota (foreground), and West Fargo, North Dakota (top center), have become parts of the suburban fringe. Heavily wooded banks of the meandering Red River mark the Minnesota-North Dakota boundary, from left to right (south to north) through the urbanized area. Warehouse-industry districts, formerly confined to the east-west rail corridor, sprawl into the grain fields, especially along the western freeway bypass. Aerial photo by K. Bordner Consultants, Inc., Minneapolis, MN.
(p.123)
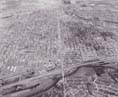
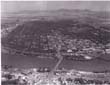
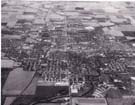
Sioux Falls, South Dakota, 1979, spreads from the south loop of the Big Sioux River and the south freeway bypass (lower edge) to the northwest airport-industrial area (upper left). Rail-era downtown district and industries developed at an early river crossing point upstream from the falls (upper center). Aerial photo by K. Bordner Consultants, Inc., Minneapolis, MN.
Sioux Falls, South Dakota, 1979, spreads from the south loop of the Big Sioux River and the south freeway bypass (lower edge) to the northwest airport-industrial area (upper left). Rail-era downtown district and industries developed at an early river crossing point upstream from the falls (upper center). Aerial photo by K. Bordner Consultants, Inc., Minneapolis, MN.
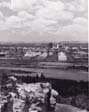
The wide Missouri flows between Bismarck (foreground) and Mandan, North Dakota, in this 1980 picture. The historic transcontinental railroad axis winds from the left center to the upper center where it crosses the Missouri. The land rises from the rail corridor and downtown area northward toward the state capital grounds (right center) and the bluffs overlooking the river. The extensive shopping mall and related expansion south of the rail corridor has spread across lower land, and its development followed initiation of flood control by the big dams on the Missouri. Aerial photo by K. Bordner Consultants, Inc., Minneapolis, MN.
A major highway heads north through Minot, North Dakota. Dense tree cover marks the area of residential growth during the 1920s and earlier, on the sheltered, but flood-risky, floor of the Souris River Valley. Post-World War II expansion had climbed the valley walls and spread to the upland plains by the mid-1970s. Aerial photo by K. Bordner Consultants, Inc., Minneapolis, MN.
(p.127)
Ponderosa pine-topped cliffs command a panoramic view northwestward across Billings in 1985. Downtown bank, oil, hotel, and civic buildings rise above the rail-industry corridor and Yellowstone River in the foreground. Residential areas spread across the flat terrace to the base of the Rim Rocks in the distance. Photo, High Plains Productions.
(p.128)
In the foreground of this 1985 mew of Rapid City, South Dakota, the College of Mines and Technology campus lies between dry, grassy foothills and the tree-lined course of Rapid Creek. The pine-covered, deeply cawed mack Hills dome rises abruptly ivest of the city. Aerial photography by Horizons Inc., Rapid City, SD 57709.
In this 1980 panorama, downtown Great Falls, Montana, adjoins the historic Missouri River crossing above the great falls. Rail-era industrial development is concentrated on the north outskirts (left), near the falls. Wheat ranching country spreads 30 miles eastward between the city and the High-wood Mountains on the horizon. Montana Air National Guard photo by Msgt. Jack W. Carte.
The
Western Montana Valleys also nearly tripled
in nonfarm population from 1940 to 1980.
The settlements include the Kootenai Valley
around Libby, the Flathead and Bitter-root
valleys from Kalispell-Whitefish-Columbia
Falls south through Missoula to Hamilton,
the Gallatin Valley around Boze-man, and the Missouri Valley from Helena to Great
Falls. The Butte-Anaconda complex, in the
upper reaches of the Deer Lodge Valley, is part
of the same urban system.
Yet, beyond that traditional base, there is a large component of footloose, self-employed people with a variety of skills, entrepreneurial talents, and survival instincts as well as a passion for a spectacular mountain setting for their activities. They live in urban neighborhoods, small towns, tumbledown gold camps, and mountain cabins. Few, if any, are wealthy by American standards. Instead of retreating from the Twin Cities or Chicago, as have most of their counterparts in the Minnesota and Wisconsin lake country, they have retreated from southern California and the Pacific Northwest, as well as nearby places —and in significant numbers from all around the country.
These
people are the piece of the economic base that
provides the mystery. Part of the base is
risk capital imported with the immigrants. Sources of the capital are usually
informal — of ten relatives; the investment might
well be unorthodox, quite small, highly risky,
or all three. Another part of the base could
better be classed as long-term expenditures for personal consumption
and leisure. Traditionally, individuals and households everywhere
make a clear distinction between work
and play. They make most of their expenditures
for personal enjoyment in small amounts, over short periods of time, and in the
locality where they live and work. There are
frequent retreats to the restaurant, bar, bowling
alley, ball game, tennis court, pool, movie
theater, and so on. Retreats to more distant
places tend to be brief—weekends at the lake,
a Las Vegas weekend, a week's excursion to
the mountains. But it is also possible to package
those expenses and pleasures in a quite
different way. A household can live austerely
for some years —drive 10-year-old cars, save intensely in many ways.
Eventually the wage
earners may quit their jobs and embark
on a large expenditure for personal enjoyment,
spread over a long period of time, in a remote
place. They might buy a good four-wheel-drive
pickup truck and other basic equipment,
move to a mountain valley, buy a place,
and settle there. Interest earnings or cannibalized
savings might be augmented by a service job, part-time logging, guiding, art, handicrafts,
roadside storekeeping, raising a few
cattle, and hunting. Long-term stability depends
not only on the combined value of the savings
and the supplemental work but also on the durability of the spirit. This mysterious phenomenon has at least two definitions. In one lexicon it is "alternative life style"; in another it is "economic base"— though, in the available data sources, any measure of it as economic base is buried at best as "miscellaneous" or "other" activities. This phenomenon has become part of the economy of almost everyplace in the United States. Measuring it seems less urgent in areas where most of the economy is traditional and institutionalized, and not understanding this mysterious sector leaves only a small part of the base unaccounted for. But the problem is more important in areas such as the Montana valleys and the Minnesota lakes, where the phenomenon explains a significant part of the population growth.
Meanwhile, the Butte-Anaconda area has thus far attracted little new economic activity to shield it from the collapse of Anaconda Copper Company's Montana operations. The population there has declined more than 20 percent since 1940, with no respite in view, while the other places in the Western Montana Valleys have grown threefold in the same period to reach a 1980 population of more than one-third million. Population trends have been most volatile in the Great Falls urban area, because of the copper-refining shutdown, the loss of railroad employment with which James J. Hill once helped to launch the place, and the vicissitudes of the military air-base industry. The Lake Superior District At the opposite end of the region, in the Lake Superior districts, four more clusters have their urban roots in the mining industry. They are striking analogues to their geographically distant cousins at Butte-Anaconda and Lead-Dead wood. The most obvious similarity is non-growth or decline of population. From the beginning, these mining towns and ports grew in areas hostile to competitive commercial farming. They never had any significant relationship to the urbanization of agricultural work. Thus they missed that drama which provided so much stimulus to urban growth and diversification in most of the Upper Midwest. The oldest commercial mining district is the Copper Range, on Michigan's Keweenaw Peninsula. Slashed from the forest and blasted from the hard-rock ridges high above Lake Superior, it was North America's leading copper producer by 1850. The need to get Keweenaw copper into the national economy triggered the building of the first Soo locks in 1855. The Keweenaw continued to lead all other copper-mining districts until Butte was developed in the late 1880s, soon after the Northern Pacific made that area accessible. Meanwhile the Marquette Iron Range became the country's leading source of iron ore in the 1870s, supplying the new, fast-growing Great Lakes steel industry. Later in the same decade, the Menomi-nee and Gogebic iron ranges were opened. Across the lake the first Minnesota production came from the Vermilion Range in the 1880s. The Mesabi Range, centered on Hibbing and Virginia, opened in the 1890s. Mesabi ore production quickly eclipsed all others because its ore bodies were not only very large and high-grade but also easily mined by open-pit methods. Within two decades, the yawning open pits were strung like beads for 60 miles along the ore railroads from east of Virginia southwestward nearly to Grand Rapids.
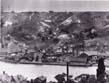
Across from Houghton, Michigan, the Quincy Mining Company smelter and docks pressed against the north shore of the Portage Lake embayment of Lake Superior at Hancock in the early 1900s. The mine works were partly visible on the top of the hill. At that time, the Upper Peninsula of Michigan was the world's major copper producer and led the United States in iron ore production. Photo, Louis G. Koepel, Quincy Mining Company.
On a bright autumn day in 1982, the forested Keweenaw Peninsula rises above the deep trench of the Portage Lake channel. The historic downtowns of Houghton (left) and Hancock stand at opposite ends of the bridge. The Michigan Technological University campus dominates eastern Hough-ton (foreground). Suomi College (Finnish Lutheran Synod) and medical facilities are other major buildings. Quincy Hill rises above the old smelter site east of Hancock (extreme right). Photo, Keweenaw Tourism Council.
Because
the Iron Range urban communities
have depended so heavily on mining, their fortunes
have been kept on a roller coaster by war,
depression, new discovery, exhaustion, mechanization,
pelletizing, and world competition.
But with each cycle, some momentum was lost at one place or another. Meanwhile, as
the forest gradually recovered, the wood-based
industries grew slowly in the neighborhood of some mining communities.
Attracted by deep
winter snow, the scenery of the glacier-scoured
shield and Lake Superior coasts, and
the unique history, the annual tourist stream
grew from a few thousand in the rail era to hundreds of thousands in the auto
era. But by 1980 that
had not yet been enough to offset the mining declines.
The
net result has been an auto-era growth history
quite different from that of the other main urban population clusters of the
Upper Midwest. The Lake Superior clusters were home
to 524,000 people in 1980. But that reflected
a growth of only 19 percent from 1940 to
1980. The inactive Menominee-Gogebic and Copper
ranges declined 15 percent, and the active
Mesabi-Duluth-Superior and Marquette areas
grew 34 percent. The picture at Duluth-Superior
was more complicated. The Twin Ports
retained their massive tonnages, especially
in ore, grain, and coal. But larger, faster, and
more specialized ships and trains increased
efficiency and cut employment in transportation.
The lumbering decline had already
reached bottom at the beginning of the auto
era, and the stagnation of wholesaling and
heavy industry that was portended at that time did indeed develop. The timing of Duluth-Superior's emergence in the nation's transportation
evolution was not quite right. Because
of railroad improvements and the Panama
Canal, the Great Lakes waterway never did develop as the major link in the northern
transcontinental general cargo route.
Thus the Zenith City did not materialize as
the strategic location promised in early commercial
dreams. Consequently, the growth rate was
very sharply reduced from the boom years of the steel rail era. The Twin Ports
had catapulted to one-fourth the population of the Twin Cities by 1920, but by
1980 they had fallen back to
one-tenth.
Prolonged
stagnation and shrinkage have produced
selective abandonment, rehabilitation,
and redevelopment in the Lake Superior urban
areas. There has been an inexorable sorting
of residential and business locations. Marquette,
Houghton-Hancock, and Duluth-Superior
have emerged as centers of maintenance or growth. Those urban areas house the
state universities in the Lake Superior district,
with accompanying income transfers from other parts of their states. They have also become
the centers of health services, business services, shopping, and
communication. The largest cities on the Mesabi Range-Virginia
and Hibbing — have been similar centers of
maintenance or growth. But they have been even more dependent on the
mineral industry, and their fortunes even
more subject to fluctuation and uncertainty. Outside the Clusters Three-quarters
of all Upper Midwest land and
one-quarter of the nonfarm population are
outside the main clusters of urban growth. Four
large groups of counties make up those outlying
areas. They include large parts of the Corn
Belt, the subhumid and semiarid Great Plains, the more sparsely settled parts of
the northern Great
Lakes forest, and the more rugged
parts of the Montana Rockies. Well over
half the urban centers in the Upper Midwest
— more than 70 — are in these four outlying
areas. Almost all are located in the main cropland
corridor that stretches from western Wisconsin to northern Montana. Their
emergence
as urban centers reflects not only their legacy
as county-seat trade centers but also the auto-era
transformation of farm work into urban
jobs and the concentration of the resulting urban
growth at established centers.
(p.134) The
urban centers in the outlying areas are mostly
at the lower end of the size-rank order. Of
the 70, only two are secondary wholesale-retail-service
centers — Aberdeen, South Dakota,
in the James Valley at the eastern edge of the
Great Plains, and Mason City, in the Iowa Corn
Belt. Both owe their relatively large size to legacies from the steel rail era.
All the other outlying
urban centers are in the lower three commercial
size ranks.
In their way, the outlying counties also reflected the geographical concentration of population during the automobile era. As a result of the shift to the main urban clusters, their share of Upper Midwest nonfarm population has fallen from 34 percent to 26 percent since 1940. Meanwhile, that remaining 26 percent was concentrating more and more in the 70 urban centers. Changing Fortunes of the Cities So
impressive and seemingly inexorable has
been the population concentration process in
the auto era that the mere recognition of it began to take on the aura of a
social science law.
The widespread notion developed that growth
depended on size alone: growth begets
growth; grow or die. Superfically, that noiton seemed to be true. There was a
clear shift of population up the size-rank order, from
the smaller to the larger. Between 1940 and
1980, the Twin Cities share of the region's nonfarm
population grew 5 percent. Regional wholesale-retail-service
centers captured an additional 3
percent. The share of the large and medium
shopping and service centers held steady,
and that of the small shopping and service
centers fell 6 percent.
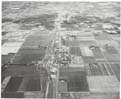
In Mason City, Iowa, 1980, scattered limestone quarries and clay pits-both active and abandoned-of the historic cement, brick, and tile industry adjoin the built-up area. Otherwise, the city is an urban island in a sea of cornfields. Aerial photo by K. Bordner Consultants, Inc., Minneapolis, MAT.
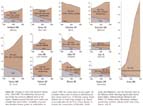
Figure 44. Changes in Farm and Nonfarm Populations, 1940-1980. The relationship between the two trends has varied in different parts of the region. Nonfarm growth has been more erratic and unstable than farm decline. Instability of growth rates therefore became greater as urbanization increased. With the county name on each graph, the principal urban center is shown in parentheses for each county except two. (1) McLean county, North Dakota, has no center large enough to be classed as an urban place by the U.S. Census Bureau. It includes the communities of Riverdale, Underwood, and Washbum, near the Garrison Dam on the Missouri River and large lignite-fired electric power plants, midway between Bismarck and Minot. (2) Anoka county, Minnesota, embraces several large northern suburbs of the Twin Cities. Source: note 61.
In contrast with the long-term disturbances of the order in the settlement system are the even more chaotic, complex, and unpredictable short-term fluctuations. In the great farm-to-urban metamorphosis of the past half-century, there was a great deal of variation from one part of the region to another in the relation between farm population decline and nonfarm population growth. To be sure, that variation reflected in part the concentration of most of the nonfarm growth at a relatively few urban centers. Farm population declined in every county while the compensating gains in nonfarm population were much more unevenly distributed. But a great deal of variation emerged within each county from one decade to another. Nonfarm growth has been more erratic and unstable than farm decline. As a result, the shift from the farms has been accompanied by increasing fluctuation and uncertainty in overall population-change rates in almost every county across the region (Figure 44). During the 1970s, some short-term trends departed notably from the path of long-run changes during the auto era. One departure appeared at the regional metropolis. While the population of the Twin Cities area, including the Commuter Ring and the Satellite Ring, climbed from 2.4 to 2.7 million, for the first time in a century its share of the Upper Midwest total population dropped slightly, from 38 to 37 percent. Growth in the suburbs and satellite areas increased, but not enough to offset the losses in the old central-city cores. Thus auto-era reduction in density continued, while overall growth slowed. Some observers classed that trend a turnaround from long-term concentration in the metropolis. Others viewed it as a slowdown of the concentration process. To still others, it was only a temporary pause in the stampede to the big cities. Also during the 1970s, already-fast growth accelerated still more in the Minnesota Lakes, Upper Wisconsin Valley, and Western Montana Valleys. Again, some viewed that increase as the other half of the turnaround—a reversal at last of auto-era rural population decline. But others saw it as metropolitan sprawl continued and enlarged. There were also sharp increases in the already-strong concentrations of growth at urban centers in the semiarid and subhumid western farming country.63 All these changes lay within the range of fluctuations observed in previous decades. Hence no one can be certain whether the region must prepare to cope with a new era or only patch up the aftereffects from yet another unexpected decade. The longer we watch the process of differential growth and development, the more it seems that nearly everything is explainable, if one waits long enough for adequate hindsight-but almost nothing is predictable. The process is indeed fascinating and frustrating.64 Meanwhile, what is the effect on community spirit of this added turbulence that boom and decline bring to the swirling demographic stream? On the one hand; in the fast-growth centers, immigrants outnumber emigrants by a ratio of 2:1 or 3:1. Young households add relatively high birthrates to an already large inflow. Acres of new commercial development, new subdivisions, and mobile-home courts are prominent in the landscape. There is a challenge to maintain a spirit of community and the current of continuity in so turbulent a demographic stream. But optimism, vigor, and expanding wealth support the effort. On the other hand, in the nongrowth centers, emigrants outnumber immigrants 2:1 or 3:1. A relatively large proportion of older households results in a relatively low birthrate to further dampen an already-low inflow. Acres of weedy and littered open space, hollow business facades, patched-up monumental Victorian buildings, and plain ruins are prominent on the land. In urban areas of clearly visible abandonment, community spirit and continuity must be tested most severely. We wonder where the best lessons are learned—in boom or adversity? Perhaps the results of those tests are as uncertain as the booms and declines that cause them. |
|
|