![]()
![]()
![]()
![]()
![]()
![]()
![]()
![]()
![]()
![]()
![]()
![]()
|
|
|
(p. 79) Chapter 4 Turbulence and Continuity
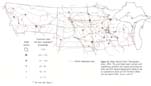
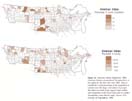
People in the Upper Midwest adapted with remarkably little delay to the new epoch. They embraced the new transportation and communication technologies quickly and used them to create increased income, savings, and wealth. In the process they transformed the landscapes and the maps of the region once more. This time it was not a change from natural wilderness to settlement but a transformation of the settlement itself. The first half-century, 1870-1920, had been dominated by land expansion, immigration, and rapid population growth. Now the region turned to a new half-century dominated by land improvement, emigration, and economic growth. The Transportation Explosion During this new half-century highways became the ubiquitous, national, general-purpose carrier of people and goods. The swelling fleet of cars and trucks first replaced buggies and wagons in the short-haul business. Then they entered the long-haul market and captured the passenger traffic and much of the general cargo from the railroads. The number of buggies in the nation dropped from 30 million to virtually zero in 60 years, while the number of registered automobiles- rose from 9 million to 120 million. At the same time, the number of horse-drawn wagons fell from 20 million to near zero, and the number of registered trucks rose from one million to 35 million. Between 1920 and 1980 the highway share of the nation's total ton-miles of freight grew from one percent to 24 percent. Highway passenger-miles grew from 39 percent to 85 percent.45 PAVING AND DECENTRALIZATION Paving
was the key, and many other improvements
followed. Construction crews spun a
2-million-mile web of blacktop and concrete
in the United States between 1920 and 1980.
The total national road mileage outside cities increased only about 10 percent, but the
surfaced mileage
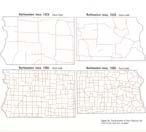
grew 550 percent. Maps show several Upper
Midwest examples of this spectacular
change (Figure 24). A 10-county area in northwestern Iowa had only 500 miles of
surfaced roads, mostly gravel, as recently as 1928.
By 1980 the same area had 2,000 miles of paved highways. Improvements
were made everywhere
in those counties, but the paved road
network is 50 percent more dense on the glacial-drift plains than it is in the
unglaciated hill
country. Public investment in roads, like private
investment in farm improvements, concentrated
on the best land. Road improvements accompanied the gradual shift of
agricultural
productivity away from the areas near the
Mississippi River, which had the advantage
of an early start, to the upland prairie areas, which had the long-run advantage
of level land and
deeper soil. Across the state, in a
12-county area of northwestern Iowa, 2,300 miles of pavement in 1980 replaced
about 40 miles of
pavement and 560 miles of gravel in 1928.46
(p. 80)
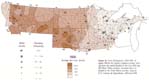
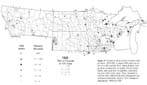
Figure 24. Transformation of State Highway Networks in the Auto Era. (4 pages)
(p. 81)
Figure 24, continued. The system grew from a few poorly connected segments of gravel road in the mid-1920s t a dense, integrated grid of pavement in 1980. Comparative mileage of mid-1920s gravel and 1980 pavement in the five different areas shown was 40 miles and 500 miles in northwestern Iowa, 500 and 5,000 in northwestern Minnesota, 300 and 1,500 in northwestern North Dakota and adjacent Montana, and 600 and 3,200 in northern South Dakota. Source: note 43.
Figure 24, continued. Transformation of State Highway Networks in the Auto Era.
(p. 83)
Figure 24, continued.
(p. 84)
The change was even more striking in the areas
of more recent settlement. In 15 northwestern
Minnesota counties overlapping the Red
River Valley, the Big Bog, and the moraine-and-lake country, more than 5,000
miles of
pavement in 1980 replaced 500 miles of gravel
in 1925. Roads had been improved at the same
density in both the flat Red River Valley and
the rough moraine-and-lake country. The improved
roads reached large grain farms, small
dairy farms, and recreational lake areas
alike.
Highways were less improved in the Indian
reservations, but they crossed the Big Bog to
join towns and farming districts on either side.
In a vast area of northwestern North Dakota and adjacent Montana, about 1,500
miles of paved highway in 1980 contrasted with
only 300 miles of gravel in 1923. And in a comparable
area of northern South Dakota 3,200
miles of pavement had replaced about 600
miles of gravel. The investment there was heaviest
east of the Missouri River, in the area of
highest population density and agricultural productivity. Nevertheless, by east
river standards,
there was nearly twice as much pavement
west of the river as population and land productivity
would justify. The high level of west
river improvements was possible because
the formula for distributing highway tax money
takes into account need as well as ability
to pay. In part, highway funds serve to redistribute
income from the more productive to
the less productive areas. Unlike the railroad
map, the road map in part reflects the role of
the state as a community organization to share resources for the common benefit.
Because
the public built it, the highway network was
a social and political as well as an economic
enterprise.
In
the same half-century the railroads were
transformed from generalists to specialists.
While total annual passenger-miles
by all modes of travel increased nationally
more than tenfold in 60 years, the railroads' share
dropped from 48 percent to less than one percent.
Freight ton-miles increased nearly fivefold
in the same period. But the rail share decreased
from 86 percent to 36 percent. The railroads
virtually went out of the passenger business, and in freight they specialized
increasingly
in long hauls, large shipments, and bulk
commodities. Average locomotive and freight
car mileage per day tripled; specialized types
of cars proliferated; efficiency in freight handling
increased sharply with specialization.
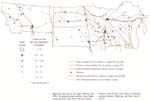
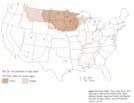
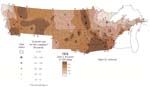
Figure 25. Pipe Lines in the Upper Midwest, late 1970s. The network joined norther Great Plainsoil and gas fields with Twin Cities and Eastern markets. It also tied the Twin Cities to oil and gas sources in Kansas, Oklahoma, and Texas. Source: note 47.
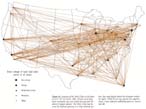
Figure 26. Location of the Twin Cities in the Busiest U.S. Air Corridors, 1983. Almost every high-order metropolis was now linked directly with all others (2 pages) (above). The Twin Cities had become the regional gateway to a truly national system. But most flights linked the strongest centers (at right). While the air age opened new opportunities, it also reflected established patterns. Source: note 48.
(p. 87)
Figure 26, continued.
(p. 88)
EMPIRE TO NEIGHBORHOOD: THE PERSISTENT REGION Through
this half-century of revolutionary
change, the Upper Midwest regional circulation
pattern persisted. A 1960 map of longdistance
telephone traffic showed that the region
of dominant flow to the Twin Cities still extended
from the Bear Paws in Montana to the
Porcupines in Michigan and from northern Iowa
to the Canadian border (See Figure 4). Strong,
though not dominant, ties reached out farther,
to the eastern and western edges of the
banking region. Fifteen years later another map
of telephone traffic repeated the earlier pattern
(Figure 28). It also showed the strong interaction
that had developed between the Upper
Midwest, Colorado, and the inter-mountain Southwest. An analysis of parcel post
origins and destinations in 1965 produced a
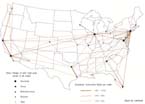
like pattern (Figure 29). In 1983 the region was
confirmed yet again on a map of the Twin Cities
share of airline flights originating at smaller
cities in the Middle West and Great Plains
(Figure 30). The area of Minneapolis-St. Paul
air traffic dominance was almost identical with
the area of railway mail dominance in 1924.50
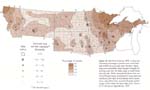
Figure 27. Major Electric Power Transmission Lines, 1970s. The grid linked major markets with neighboring coal-fired and nuclear generating stations and with resource-based power plants at major hydroelectric dams and the Northern Plains coal and lignite fields. Source: note 47.
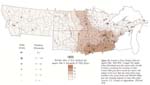
Figure 28. Phone Traffic: Twin Cities Focus, 1975. The pattern reflected the outlines of the Upper Midwest primary region and strong interregional ties with Chicago, Detroit, and the Southwest. Source: note 50.
(p. 91)
Figure 29. Parcel Post: Twin Cities Focus, 1965. The map outlines, for the cities shown, the region of dominant parcel post flow to the Twin Cities and competing high-order urban areas at Chicago-Milwaukee, Denver, and Seattle-Portland. Source: note 50, Post Office Department.
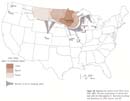
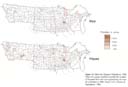
Just as the railway mail flow had indicated the amount of business transacted between the Twin Cities, the region, and the rest of the world in 1924, so also the flow of long-distance phone calls probably reflected the same relations in 1975. The torrent of messages was still there and still growing. It was just moving on the phone lines instead of on racks of mail bags in the railway postal cars. The phone call pattern indicated that perhaps 35 percent of the Minneapolis-St. Paul basic economy in 1975 depended on business with the rest of the region, compared with 55 percent a half-century earlier. The other 65 percent depended on business with the rest of the United States and the rest of the world, compared with 45 percent 50 years earlier. But that was only one way to look at the change. To be sure, the region's importance to the metropolis had declined in relative terms, but it grew in absolute terms. Between 1924 and 1975, Twin Cities personal income, in constant 1975 dollars, rose from about 3 billion to about 13 billion. Thus the region accounted for 55 percent of a $3-billion economy, or about 1.7 billion, in 1924; and it accounted for 35 percent of a $13-billon economy, or about 4.6 billion, in 1975.51 From the 1940s into the 1970s, the metropolis grew faster than the remainder of the Upper Midwest. It did so in part by increasing its interaction with the rest of the region. Of all the business done in the rest of the region in 1975, it appears that about 13 percent was transacted with the Twin Cities, compared with 10 percent 50 years earlier. That change probably reflected increased trade with Iowa and northwestern Wisconsin which more than offset a somewhat weaker link with Montana and western South Dakota.52
Figure 30. Regional Air Service to the Twin Cities Hub, 1983. The area of dominance is almost identical with the Minneapolis-St. Paul area of railway mail dominance in 2924. Source: note 48.
(p. 93)
Although
the regional pattern persisted, it did
so in a shrunken and more interactive world.
That meant more competition. The region's hub airport provided a good vantage point
from which to consider what happened. In
1983, Twin Cities International was one of 35
major airports in the United States. Together
those 35 hubs handled more than one-third of
the country's scheduled airline departures and
more than two-thirds of all travelers. The Twin Cities were one among 29
high-order metropolitan complexes that together contained
nearly two-thirds of the nation's people and
transacted more than two-thirds of its business.
Likewise,
the region the Twin Cities hub
airport served was one of 29 metropolis-centered
regions which, together, encompassed the entire national competitive economy. The Upper
Midwest's regional air hub was a crossroads
in a dense network of routes that covered the map of the United States. Although
air service was concentrated in an East Coast-California
corridor, to a remarkable degree
the routes connected each of the high-order
metropolitan centers directly with all of the others and symbolized fast,
intense, unending transfers of knowledge,
talent, and capital among those
centers and regions. Every place
could feel quickly the shocks of new products, organizational
arrangements, and investments at other
places in the network. Thus the result
of the transportation explosion was
not only more competition but also more instability—more turbulence in the complex
forces
that kept changing the fortunes of each metropolis
and region. In 1920 the region was still an empire in a world that was much less accessible and more segmented. By 1980 it had become a kind of neighborhood, or community, in a world that was much more interactive and seemingly even more uncertain. People and institutions in the region have adapted to those environmental changes. Individually and collectively, they have made decisions and taken actions that maintained some of their legacies yet dramatically transformed the landscape. Much of the adaptation was reflected in the changing maps of population. The Shift in National Migration Patterns By
1980 the total population of the Upper Midwest
reached nearly 8 million. One-third of
the total lived within 100 miles of the Twin Cities
metropolitan airport, and two-thirds lived
east of the James River Valley and west of
the upper Wisconsin. But the long-term trends had changed. A slowdown in overall growth had accompanied a dramatic shift in large-scale migration. Between 1870 and 1920, population streamed into the region. Net immigration was 3 million, and the total population increase was 5 million. In the auto era the flow was reversed. Between 1920 and 1980, net emigration was 1.25 million, while the total increase dropped to 2.2 million—less than half the rate in the railroad era. INCREASING HOMOGENEITY, EMERGING MINORITIES As
a result of the migraiton patterns, the population
became much more homogeneous.
By 1980 almost 98 percent were American-born.
More than 70 percent were born in the Upper Midwest. Another 11 percent were
born on the West Coast, and many of
those were returning to the homeland of their
Upper Midwest parents. European-born population
dropped from one million in 1920 to
100,000 in 1980. Most of that much smaller number
were the last of the early twentieth-century immigrants who were still alive.
European-born made up only about one percent
of the population in most counties. The figure was 3 or 4 percent in areas of
sharp population
decline —where large numbers of young people
had departed and elderly survivors made up a significant part of the population-and
in western and northern counties that
were in the last wave of pre-World War
I settlement. Small but significant
European migration continued only in growing
urban centers of international business
employment or universities. Thus virtually
the entire population of the region was now
not only white but also English-speaking.53
(p. 94)
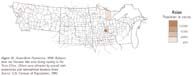
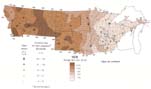
Figure 31. Asian-Born Population, 1980. Refugees from the Vietnam War were living mainly in the Twin Cities. Others were attracted by several state universities and international business firms. Source: U.S. Census of Population, 2980.
As
another result of the migration shift, Indian
population in 1980 outnumbered European-born
whites for the first time since before the Civil War. The census count of 157,000,
though still fraught with uncertainty, was
probably the most accurate ever taken. Reported
growth was nearly 50 percent in the decade
from 1970 to 1980. About two-thirds of the
increase could be accounted for only by immigration
from other parts of the United States or
by improved counting—probably the latter. Nearly two-thirds of the total lived
in counties with reservations (Figure
32). Most of the others were about
equally divided between the Twin
Cities and a group of six smaller metropolitan
areas including Great Falls, Billings,
Rapid City, Bismarck-Mandan, Sioux Falls,
and Duluth-Superior. Thus there has been
relatively little mobility since the tribes were pinned to their reservations at the close
of
the rail-building era. What mobility there was
consisted mainly of oscillation between the
reservations and a few urban ghettos. With the
high growth rate, Indians had become a majority
of the population in several western counties
and significant minorities in seven metropolitan
areas. In fact, all the net growth of
Great Falls in the 1970s was accounted for by the
increase in Indian population.
(p. 95)
Figure 32. American Indian Population, 1980. American Indians outnumbered European-born in the region for the first time since 1860. They accounted for a high percentage of the population in counties near the larger reservations (top map). But about one-third of the region's total number were minorities in the Twin Cities and six smaller metropolitan areas (bottom map). Source: U.S. Census of Population, 2980.
(p. 96)
Figure 33. Black and Hispanic Populations, 1980. These two groups combined exceeded the number of European-bom and were approaching the number of Indians in 1980. Source: U.S. Census of Population, 1980.
TURBULENCE AND CONTINUITY The
Upper Midwest's slower growth and net
out-migration since 1920 could imply that the
population became more stable. But that has
not been so. The gross numbers have hidden
a complex, turbulent process. Like any region,
the Upper Midwest has always been something
of a revolving door. The people moving in and out have embraced every age, income,
and occupation group. They arrive and
depart in search of work, security, stability,
education, or experience. The distinctive thing about Upper Midwest migration in
this era has been the
reduced number of people arriving
and the higher proportion of people leaving.
In the 1960s and 1970s, nearly 60 percent
of all movers were under age 30; two-thirds
of those were under 25. Overall employment
growth in the region has been enough to absorb
only about two-thirds of the natural increase
in that age range. The other third has eventually
sought jobs elsewhere. In recent years,
another 10 percent of the people who have
moved have been 65 years old or more. The
retirement age group has become much more
able to head for the Sun Belt since the advent of pension and annuity programs on a
large
scale in the 1920s and 1930s. The remaining
one-third of the movers were in the least mobile,
30 to 65 age range. In that bracket migration
to and from the region has been about
in balance, but normal changes in health, employment opportunities, and
family circumstances
have kept part of the population
in motion at all times. CORRIDORS OF MOVEMENT Net
outflow has exceeded net inflow in every
state in the region since the 1920s, and in the
Dakotas since the 1910s. The first detailed study
of the process covered the period from 1955
to 1960. At that time, four corridors accounted
for 85 percent of the moves to and from
other parts of the United States. The net flow
was out of the region in all four corridors. The
busiest migration routes led west and southwest
to the Pacific Coast, Denver, Arizona, and New Mexico. That corridor carried
36 percent of all the
migration to and from the Upper
Midwest. Almost as important, with 35 percent
of the migrants, was the corridor to Milwaukee
and Chicago, and eastward through
other major metropolitan employment centers to Boston, New York, and Washington.
A third corridor, with 10 percent of
the migrants, ran southward to St. Louis and
Kansas City, and on to New Orleans, Dallas,
and south Texas. Another 7 percent of all migrants
moved between the Upper Midwest and
the Southeast. The remaining 12 percent of
domestic moves were between states of the region
and neighboring Iowa and Nebraska.56 The different streams varied somewhat in their population characteristics. Both the southern and western corridors carried people in every age, occupation, and income group. A high proportion of the streams to and from the East were professionals, technicians, salespersons, or managers in large national business organizations and the federal government. Retirees and military made up the greater part of the southeastern flow. Meanwhile, foreign migration—not only military but also business and professional people and students — equaled 10 percent of domestic migration, notwithstanding the region's deep interior location.
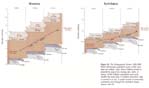
Figure 34. The Demographic Stream 1950-1980. While Minnesota's population grew a little more than one million, more than 6 million arrived or departed by way of the moving van, stork, or hearse. North Dakota's population grew only 34,000, but more than 1.4 million were born, died, or moved in or out. A small current of community continuity runs through the turbulent stream. Source: note 55.
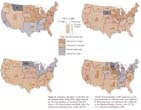
Figure 35. Changing Migration to and from Upper Midwest States 1950s-1970s. Major features are the long-standing net movement from the region to the Intermountain and Pacific West, the growing net movement to the South, and the reversal of long-standing trends resulting in a net movement from the Northeast and Lower Midwest to Minnesota and a net movement from California to the Montana Rockies. Sources: notes 55, 58; U.S. Census of Population, 1980.
(p. 100)
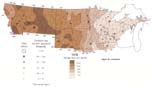
Figure 36. Farm Enlargement, 1920-1978. (2 pages) Within the region's cropland corridor, average farm size nearly doubled in the Corn Belt and Red River Valley counties, increased three- to fivefold in the Great Plains counties. Sources: U.S. Census of Agriculture, 1920 and 1978.
Figure 36, continued.
(p. 102)
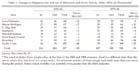
Table 1. Changes in Migration into and out of Minnesota and North Dakota, 1950s-1970s (In Thousands)
Table 2. Changes in Migration into and out of Montana, 1950s-1970s (In Thousands)
Migration today is still concentrated in those same corridors. But some changes in volume and direction have occurred (Figure 35). The flow to and from Chicago and the East has increased slightly. But the direction of net movement has reversed sharply. A weak outflow from the region has changed to a strong inflow (Tables 1-2). Meanwhile, migration to and from the Southeast has more than doubled. The increase probably reflects not only more retirees to Florida but also more business-related moves to both Florida and the cities of the Georgia and Carolina Piedmont. Migration between the Upper Midwest, Colorado, and the Southwest has grown threefold. Net out-migration in that corridor is four times the 1950s level. In contrast, the volume of flow to and from California has stabilized, and the out-migration to California is down nearly one-half.57 Thus, during this era of adaptation, the Upper Midwest changed from primarily a destination for immigrants to an entrepot in the national shift toward the West and South. The region takes in people from the East and sends people out in somewhat larger numbers to the West and South. The addition to the outflowing stream comes from the region's own well-spring of human energy and talent. The production of emigrants has come from farms, small towns, and urban centers of all sizes. There has been some tendency for a chain of movement up the hierarchy from farms and small towns to nearby urban places, then with increasing experience and contacts, to larger, more distant places. In any chain of moves, no matter how complex the pattern, there must be some places where the chain starts—where people keep leaving and few or none return. In the Upper Midwest those places have been farms and rural hamlets, and for many years the dominant larger, more distant place was the Twin Cities.58
The Shift from Farm to City The region's farm population dropped from 2.7 million in 1920 to under 700,000 in 1980. The events were complicated, with no simple line of causation. But if one element could be singled out, many observers would point to the farm tractor. More power and speed in the fields opened the way to bigger farms, more production for sale or livestock feed, and more dollars earned per farm—but eventually 80 percent fewer people needed to do the farm work (Figure 36-37). To be sure, mechanical improvements were not new. Harvesting machinery and cumbersome steam tractors, for example, had been in use for decades. But the surge in efficiency and mobility of tractive power brought revolutionary changes in the size and variety of other field machinery. That, in turn, brought a surge of growth in both earning power and capital requirements . Higher capitalization meant more land for each farmer, and also opened the way for greatly increased use of scientifically developed seed and a multitude of specialized chemicals. Much has been said about the impact of the automobile on the rural scene. But never forget the tractor. THE DECISION TO LEAVE OR TO STAY During
this massive reduction of farm labor
force, the largest group of off-farm migrants
has left at the age of high-school graduation.
Some have moved to a nearby urban
center, in recent decades most often to one large
enough to have a wide range of business and
government jobs and a trade school or two.
Others have gone directly to distant centers, virtually always in a channel provided
by
relatives, college enrollment, or military enlistment.
At a little older age level, many young
farmers have taken jobs in neighboring towns
and reduced their farming operations to part-time
by selling off livestock or renting part
of their land (Figure 38). They have thus contributed
to the statistics that show both large
farms and small farms increasing in number.
Eventually some might quit farming altogether,
sell their land, perhaps their houses. For
still older farmers, who waited or were caught
by circumstances at age 40 to 60, the shift
has been hardest. Some have taken menial
work in towns. Many have held on. With limited
capital and low returns, they have helped
to pull down average family income to the comparatively low levels that persist
in rural areas. Those past 60 years old have eventually
retired - on their farmsteads or in a nearby town,
perhaps to sojourn in south Texas during
midwinter. In each case, the statistical end result
is a decline in the number of farm people and
farm operators. Then
there are the survivors. Some have been
farm youth who remained; others left for education
or nonfarm experience and later returned. Both
groups have taken over the fewer, bigger, and
more complex units and gradually enlarged them further. There has been
a constant renewal process, with an extra surge of new vitality at the end of
World War II, when many young men returned from military
service and took over from aging parents who
had been holding on since the late 1930s. In the 1970s, a segment of the children of those
World
War II veterans began to take over in turn.
By that time the capital requirements had grown
still larger. The newest generation found
itself in a stormy sea of unstable prices, high
costs, and further heavy borrowing. In that
generation, even some of the young, energetic,
self-selected survivors faced the possibility
of having to quit in the 1980s. Like mechanization, the shift off the farm did not begin with the automobile and tractor era. The wave of net migration out of farming followed the settlement frontier westward across the region, with a 15- to 20-year lag. It set in during the 1880s in the southeastern counties and finally reached the Montana High Line in the 1920s. It was a natural development. As the frontier closed and families matured, the supply of surplus labor grew and the number of new farming opportunities declined. But the rate of change in this era has no precedent.59 THE URBANIZATION OF FARM WORK While
farm population declined 2.1 million,
nonfarm numbers grew 4.2 million. In the
region's main agricultural corridor from western Wisconsin to northern Montana,
the same forces stimulated both changes.
Increased
capitalization and productivity raised real
farm income per square mile two- to threefold
(Figure 39). Those square miles of farm land
were also square miles of trade territory, nourishing
the economies of urban centers. Of course, the remaining farm families developed
substantially higher consumption levels than their
forebears —in clothing, food, transportation,
household goods, and entertainment. But
that increase was not enough to compensate
on Main Street for the greatly reduced number of farm households.
Figure 37. Increase in Value of Farm Products Sold per Farm, 1920-1978. (2 pages) While farm size in the Corn Belt and Red River Valley doubled, sales per farm increased five- to sixfold. On the Great Plains, sales grew four- to eightfold, while farm size grew three to five times. Thus, increased income per farm reflected both farm enlargement and increased productivity. Sources: U.S. Census of Agriculture, 2920 and 1978.
Figure 37, continued.
(p. 106)
Figure 38. Part-Time Farming, 1978. A large and increasing percentage of farmers earn more than half of their income away from the farm. Highways and automobiles have brought virtually all farming areas into the daily range of small towns and city jobs. While many family farms have survived through heavy investment in more land and machinery and often formed family-held corporations, may others have survived through partial merger of the urban and farm labor force. Source: U.S. Census of Agriculture, 2978.
Beyond that change, however, increased income and commercialization meant that many tasks which had been family work on the old general farm became specialized and transferred to town. Oats production for horses was transformed into gasoline purchases and delivery for tractors, incidentally freeing an average of 20 percent of the crop acreage for other uses. Horse husbandry gave way to parts and repair shops; woodcutting to fuel oil, bottle gas, and electricity; voluntary road grading to highway maintenance shops and equipment fleets. An unprecedented rural commerce evolved in vehicles, machinery, motors, batteries, chemicals, feed, seed, additives, concentrates, in welding and metal shaping, power and phone line maintenance. There were also gradual, subtle, but important multiplier effects. Professions, business services, financial institutions, public services, and construction gathered and grew around this emerging array of specialized, urbanized, former farmyard tasks. Here and there an office or a shop developed a specialty product and began to sell it though brokers in a regional or national market. Particularly impressive in the industrial directories of Upper Midwest states is the number of manufacturing firms that have sprouted from the metal and machine shops in the farm trade centers. In the Corn, Dairy, and Wheat belts, farming evolved into a gigantic, highly capitalized industrial organization with an incredibly decentralized system of ownership and management and with an intense, efficient network of information. Within that structure the towns evolved as nerve centers, windows on the world, and entrepreneurial seedbeds. They were much more than that, of course, and to some people, much less. REGIONAL MIGRATION The
off-farm movement triggered an avalanche that worked its way through the whole
system of towns and cities. While its momentum
accelerated in the tractor and trucking era, the
avalanche began earlier, when the first generation
of frontier children reached working
age. The result was the rapid release of surplus
quality labor and talent from the rural parts
of this culture region for more than 50 years
(Figure 40).
(p. 108)
Figure 39. Growth in Farm Product Sales per Square Mile, 1920-1978. (2 pages) The square miles of farmland were also square miles of trade territory, nourishing the economy of urban centers. Real gross farm income per square mile tripled in the Com Belt and main Dairy areas, doubled in the Great Plains and Flathead Valley, and was virtually stagnant in most other areas. Sources: U.S. Census of Agriculture, 2920 and 1978.
(p. 109)
Figure 39, continued.
(p. 110)
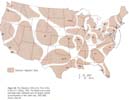
Figure 40. The Migration Field of the Twin Cities in the U.S. Setting, 1960. The shaded area around each high-order metropolis sent the largest number of out-migrants to that urban area, 1955-1960. Source: note 60.
|
|
|